pyyeti.dsp.fftfilt
- pyyeti.dsp.fftfilt(sig, w, *, axis=-1, bw=None, pass_zero=None, nyq=1.0, mag=0.5, makeplot='no')[source]
Filter time-domain signals using FFT with Gaussian ramps.
- Parameters:
sig (nd array_like) – Signal(s) to filter. Filtering is done along axis axis.
w (scalar or 1d array_like) – Edge (cutoff) frequencies where
0.0 < w[i] < nyqfor alli(w must not include 0.0 or nyq). Can be any length and filter will alternate between pass and stop (starting according to pass_zero). For example, if leaving pass_zero as default, a low pass filter is created for scalar w and a band-pass is created for a 2-element w. Units are relative to the nyq input; so, for example, if nyq is the Nyquist frequency in Hz, w would be in Hz.axis (int, optional) – Axis along which to operate.
bw (scalar, 1d array_like, or None; optional) – Width of each transition region (each up or down ramp). If None,
bw = 0.01 * nyq.pass_zero (bool or None; optional) – Specifies whether or not the zero frequency will be in a pass band. If None, pass_zero is set to True unless w has two elements. (So the default is low pass and band pass for w with one or two elements.)
nyq (scalar; optional) – Specifies the Nyquist frequency: sample_rate/2.0
mag (scalar; optional) – Specifies the target filter magnitude at each w
makeplot (string or axes object; optional) – Specifies if and how to plot filter function:
makeplot
Description
‘no’
do not plot
‘clear’
plot after clearing figure
‘add’
plot without clearing figure
‘new’
plot in new figure
axes object
plot in given axes (like ‘add’)
- Returns:
fsig (nd ndarray) – Filtered version of sig
freq (1d ndarray) – Frequency vector from 0.0 to nyq
h (1d ndarray) – The frequency domain filter function
- Raises:
ValueError – When a ramp will not fit in space as required.
Examples
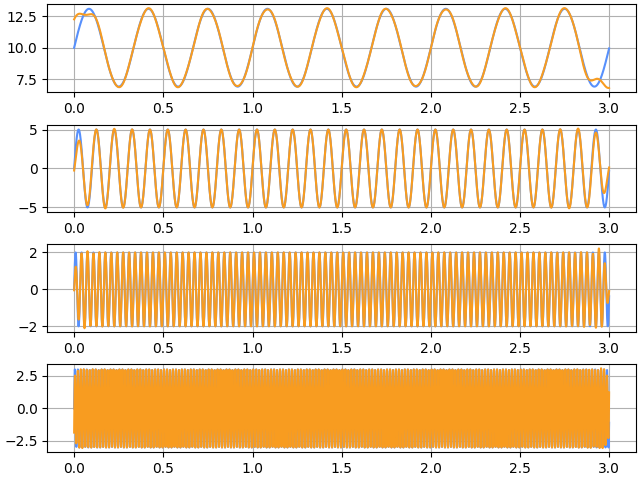
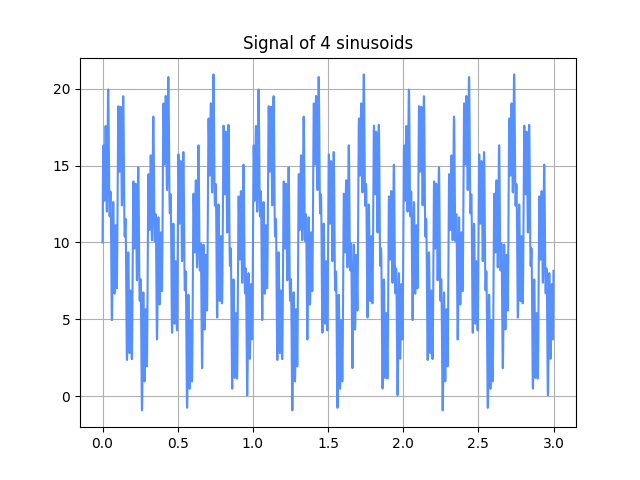
Make a signal composed of 4 sinusoids, then use
fftfilt()to try and recover those sinusoids:>>> from pyyeti import dsp >>> import numpy as np >>> import matplotlib.pyplot as plt >>> h = 0.001 >>> t = np.arange(0, 3.0, h) >>> y1 = 10 + 3.1*np.sin(2*np.pi*3*t) >>> y2 = 5*np.sin(2*np.pi*10*t) >>> y3 = 2*np.sin(2*np.pi*30*t) >>> y4 = 3*np.sin(2*np.pi*60*t) >>> y = y1 + y2 + y3 + y4 >>> _ = plt.plot(t, y) >>> _ = plt.title('Signal of 4 sinusoids')
>>> sr = 1/h
>>> nyq = sr/2
>>> _ = plt.figure('Ex1', clear=True, layout='constrained')
>>> _ = plt.figure('Ex2', clear=True, layout='constrained')
>>> for j, (w, pz, yj) in enumerate(((7, None, y1),
...                                 ([7, 18], None, y2),
...                                 ([18, 45], None, y3),
...                                 (45, False, y4))):
...     _ = plt.figure('Ex1')
...     _ = plt.subplot(4, 1, j+1)
...     yf = dsp.fftfilt(y, w, pass_zero=pz, nyq=nyq,
...                      makeplot='add')[0]
...     _ = plt.xlim(0, 75)
...     _ = plt.figure('Ex2')
...     _ = plt.subplot(4, 1, j+1)
...     _ = plt.plot(t, yj, t, yf)