pyyeti.psd.spl
- pyyeti.psd.spl(x, sr, nperseg=None, overlap=0.5, window='hann', timeslice=1.0, tsoverlap=0.5, fs=3, pref=2.9e-09, frange=(25.0, inf), extendends=True)[source]
Sound pressure level estimation using PSD.
- Parameters:
x (1d array like) – Vector of pressure values.
sr (scalar) – Sample rate.
nperseg (int, optional) – Length of each segment for the FFT. Defaults to
int(sr / 5)for 5 Hz frequency step in PSD. Note: frequency step in Hz =sr/nperseg.overlap (scalar; optional) – Amount of overlap in windows, eg 0.5 would be 50% overlap.
window (str or tuple or array like; optional) – Passed to
scipy.signal.welch(); see that routine for more information.timeslice (scalar or string-integer) – If scalar, it is the length in seconds for each slice. If string, it contains the integer number of points for each slice. For example, if sr is 1000 samples/second,
timeslice=0.75is equivalent totimeslice="750".tsoverlap (scalar in [0, 1) or string-integer) – If scalar, is the fraction of each time-slice to overlap. If string, it contains the integer number of points to overlap. For example, if sr is 1000 samples/second,
tsoverlap=0.5andtsoverlap="500"each specify 50% overlap.fs (integer; optional) – Specifies output frequency scale. Zero means linear scale, anything else is passed to
rescale(). Example:0
linear scale as computed by
scipy.signal.welch()1
full octave scale
3
3rd octave scale
6
6th octave scale
pref (scalar; optional) – Reference pressure. 2.9e-9 psi is considered to be the threshhold for human hearing. In Pascals, that value is 2e-5.
frange (1d array_like; optional) – Specifies bounds for the frequencies. Only the first and last elements are used. If the first value is < 0.0, it is reset to 0.0. If the last value is >
sr/2, it is reset tosr/2. Note that for octave scales,rescale()is used which enforces a minimum of 1.0 Hz.extendends (bool; optional) – Passed to
rescale()if an octave scale output is requested. See that routine for more information.
- Returns:
f (ndarray) – The output frequency vector (Hz).
spl (ndarray) – The sound pressure level vector in dB.
oaspl (scalar) – The overall sound pressure level.
Notes
This routine ultimately calls
scipy.signal.welch()(viapsdmod()) to calculate the PSD. It then converts that to mean-square values per band (for linear frequency steps, this is justPSD * delta_freq). Loosely, the math is:\[\begin{split}\begin{aligned} V &= \frac{PSD \cdot \Delta f}{P_{ref}^2} \\ SPL &= 10 \; \log_{10} ( V ) \\ OASPL &= 10 \; \log_{10} \left ( \sum V \right ) \end{aligned}\end{split}\]Examples
>>> import numpy as np
>>> from pyyeti import psd
>>> rng = np.random.default_rng()
>>> x = rng.normal(size=100000)
>>> sr = 4000
>>> f, spl, oaspl = psd.spl(x, sr, sr, timeslice=len(x)/sr)
>>> # oaspl should be around 170.75 (since variance = 1):
>>> shouldbe = 10*np.log10(1/(2.9e-9)**2)
>>> abs(oaspl/shouldbe - 1) < .01
True
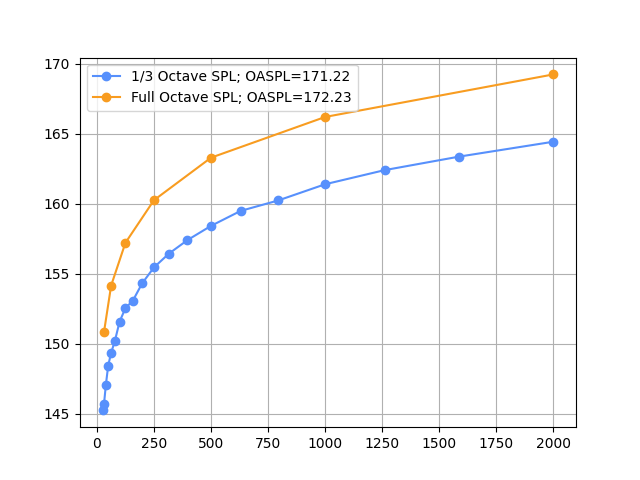
Plot the 1/3 octave SPL from above with a full octave SPL. The OASPL comes out a little higher for the full octave SPL because of the
extendends=Trueoption:>>> import matplotlib.pyplot as plt >>> full = psd.spl(x, sr, sr, timeslice=len(x)/sr, fs=1) >>> lbl = f"1/3 Octave SPL; OASPL={oaspl:.2f}" >>> _ = plt.plot(f, spl, "-o", label=lbl) >>> lbl = f"Full Octave SPL; OASPL={full[2]:.2f}" >>> _ = plt.plot(full[0], full[1], "-o", label=lbl) >>> _ = plt.legend()