pyyeti.ytools.gensweep
- pyyeti.ytools.gensweep(ppc, fstart, fstop, rate)[source]
Generate a unity amplitude sine-sweep time domain signal.
- Parameters:
ppc (scalar) – Points per cycle at fstop frequency.
fstart (scalar) – Starting frequency in Hz
fstop (scalar) – Stopping frequency in Hz
rate (scalar) – Sweep rate in oct/min
- Returns:
sig (1d ndarray) – The sine sweep signal.
t (1d ndarray) – Time vector associated with sig in seconds.
f (1d ndarray) – Frequency vector associated with sig in Hz.
Notes
The equation for a sine-sweep that uses a constant rate is:
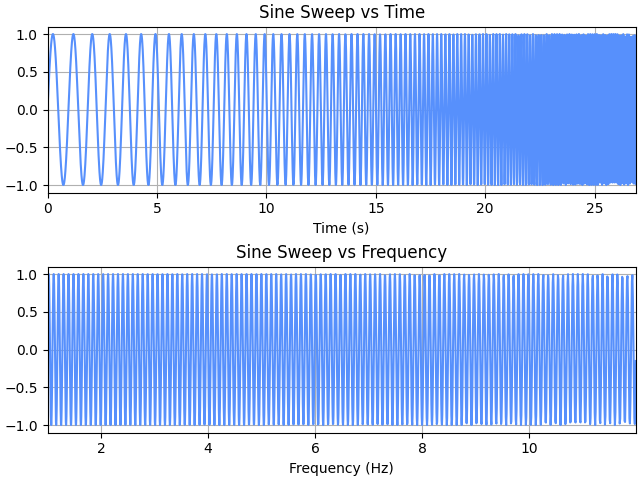
\[\begin{split}sig(f) = \sin \left ( \frac {2 \pi (f-f_{start})}{\ln(2) \cdot rate} \right ) \\ \text{where: } f = f_{start} 2^{t \cdot rate}\end{split}\]This type of sweep is linear in frequency; see plot from example.
Examples
>>> from pyyeti import ytools
>>> import matplotlib.pyplot as plt
>>> sig, t, f = ytools.gensweep(10, 1, 12, 8)
>>> _ = plt.figure('Example', clear=True, layout='constrained')
>>> _ = plt.subplot(211)
>>> _ = plt.plot(t, sig)
>>> _ = plt.title('Sine Sweep vs Time')
>>> _ = plt.xlabel('Time (s)')
>>> _ = plt.xlim([t[0], t[-1]])
>>> _ = plt.subplot(212)
>>> _ = plt.plot(f, sig)
>>> _ = plt.title('Sine Sweep vs Frequency')
>>> _ = plt.xlabel('Frequency (Hz)')
>>> _ = plt.xlim([f[0], f[-1]])