pyyeti.psd.rescale
- pyyeti.psd.rescale(P, F, n_oct=3, freq=None, extendends=True, frange=None)[source]
Convert PSD from one frequency scale to another.
- Parameters:
P (array_like) – Vector or matrix; PSD(s) to convert. Works columnwise if matrix.
F (array_like) – Vector; center frequencies for P. If steps are not linear, logarithmic spacing is assumed.
n_oct (scalar; optional) – Specifies the desired octave scale. 1 means full octave, 3 means 1/3rd octave, 6 means 1/6th octave, etc. The routine
get_freq_oct()is used to calculate the frequency vector with the default options. To change options, callget_freq_oct()directly and provide that input via freq.freq (array_like or None; optional) – Alternative to n_oct and takes precedence. Specifies desired output frequencies directly. If steps are not linear, logarithmic spacing is assumed for computing the band boundaries.
extendends (bool; optional) – If True and the first and/or last frequency band extends beyond the original data, the area of the new band is adjusted up by the ratio of the new bandwidth over the portion that is covered by the original data. This will cause the corresponding PSD value to be higher than it would otherwise be, meaning the overall mean-square value will also be a little higher.
frange (1d array_like or None; optional) – This option can be used to limit the frequency range of the output frequencies. If None, this option is ignored for cases where freq is used, but is set internally to
(1.0,
np.inf))
for cases where n_oct is used. Only the first and last elements of frange are used. Note that the output frequencies will be trimmed further if needed by the first and last values of F.Note
When the n_oct option is used, if the first value of frange is <= 0.0, it is internally reset to 1.0.
- Returns:
Pout (ndarray) – Vector or matrix; converted PSD(s). Rows correspond to the new frequency scale; columns correspond with P.
Fctr (ndarray) – Vector; center frequencies of output. Equal to freq if that was input.
msv (scalar or 1d ndarray) – Mean square value estimate for each PSD.
ms (ndarray) – Vector or matrix; converted mean square values directly (instead of density). For constant frequency step df,
ms = df*Pout. Same size as Pout.
Notes
The input PSD is assumed to be on a center-band frequency scale. For PSD specifications that use constant dB/octave slopes, use
interp()instead.This algorithm works by interpolating on cummulative area such that original contributions to total mean-square per band is preserved.
Note
Note that if the area of the first and/or last band is extended (see extendends above), the overall mean-square value will be higher than the original.
See
get_freq_oct()for more information on how the octave scales are calculated.See also
Examples
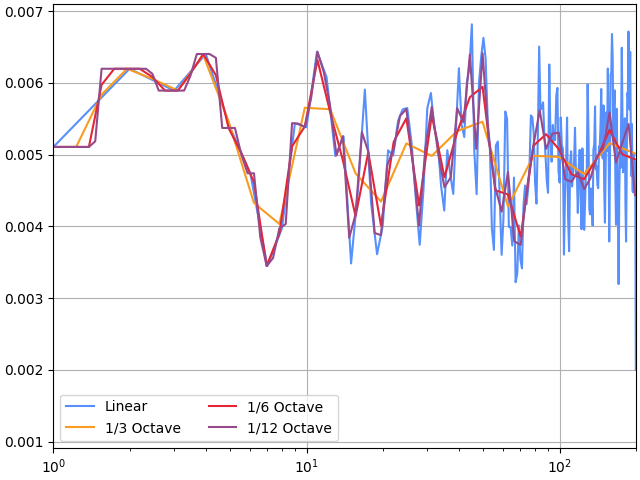
Compute a PSD with
scipy.signal.welch()and then rescale it to 3rd, 6th, and 12th octave scales starting at 1.0 Hz. Compare mean square values from all 4 PSDs.>>> import matplotlib.pyplot as plt >>> import numpy as np >>> import scipy.signal as signal >>> from pyyeti import psd >>> >>> frange = (1.0, np.inf) >>> rng = np.random.default_rng() >>> g = rng.normal(size=10000) >>> sr = 400 >>> f, p = signal.welch(g, sr, nperseg=sr) >>> p3, f3, msv3, ms3 = psd.rescale(p, f, frange=frange) >>> p6, f6, msv6, ms6 = psd.rescale( ... p, f, n_oct=6, frange=frange) >>> p12, f12, msv12, ms12 = psd.rescale( ... p, f, n_oct=12, frange=frange) >>> >>> fig = plt.figure('Example', clear=True, ... layout='constrained') >>> line = plt.semilogx(f, p, label='Linear') >>> line = plt.semilogx(f3, p3, label='1/3 Octave') >>> line = plt.semilogx(f6, p6, label='1/6 Octave') >>> line = plt.semilogx(f12, p12, label='1/12 Octave') >>> _ = plt.legend(ncol=2, loc='best') >>> _ = plt.xlim([1, 200]) >>> msv1 = np.sum(p[1:]*(f[1]-f[0])) >>> abs(msv1/msv3 - 1) < .12 True >>> abs(msv1/msv6 - 1) < .06 True >>> abs(msv1/msv12 - 1) < .03 True
Demonstrate
extendends=False. Ends will be less than input because there is a region of zero area averaged in:>>> in_freq = np.arange(0, 10.1, .25) >>> out_freq = np.arange(0, 10.1, 5) >>> in_p = np.ones_like(in_freq) >>> p, f, ms, mvs = psd.rescale(in_p, in_freq, freq=out_freq) >>> p array([ 1., 1., 1.]) >>> p, f, ms, mvs = psd.rescale(in_p, in_freq, freq=out_freq, ... extendends=False) >>> p array([ 0.525, 1. , 0.525])
The 0.525 value is from:
area/width = 1*(2.5-(-0.125))/5 = 0.525