pyyeti.ytools.fit_circle_3d
- pyyeti.ytools.fit_circle_3d(basic, makeplot='no')[source]
Fit a circle through data points in 3D space
- Parameters:
basic (2d array_like, 3 x n) – Coordinates of data points in the basic (rectangular) coordinate system; rows basic are the x, y, and z coordinates
makeplot (string or axes object; optional) – Specifies if and how to plot data showing the fit.
makeplot
Description
‘no’
do not plot
‘clear’
plot after clearing figure
‘add’
plot without clearing figure
‘new’
plot in new figure
axes object
plot in given axes (like ‘add’)
Note that if makeplot is ‘add’ or an axes object, it must be 3d; otherwise a ValueError exception is raised.
- Returns:
A SimpleNamespace with the members
local (2d ndarray, 3 x n) – The coordinates of all points in a local (rectangular) coordinate system. The z-axis is perpendicular to the plane of the circle so the z-coordinate is 0.0 for all points.
basic2local (2d ndarray) – 3 x 3 transform from basic to local. The local system is defined such that the z-axis is perpendicular to the plane of the circle.
center (1d ndarray) – Coordinates of circle in basic system (3 elements: x, y, z)
radius (scalar) – Radius of circle
ssqerr (scalar) – Sum of the squares of the radius and z-axis errors for each point. For a perfect fit, this will be zero.
Notes
At a high level, this routine works by: one, forming a (non-unique) transform to a local coordinate system (steps 1-5), two, finding the center in basic coordinates from the chord bisector approach (steps 6-9), three, finding the radius (step 10), and four, optimizing the fit (step 11).
Set
n = basic.shape[1].Create two vectors:
v1is from point 1 to pointn // 3, andv2is from point 1 to point2 * n // 3.Form unit vector from the cross product of
v1andv2to get a perpendicular axis to the circle. This is the local z-axis and the 3rd row of the transformation matrix basic2local.The local x-axis is defined as the unit vector of
v1. This is the 1st row of basic2local. Note that this is just the initial orientation; the final local x-axis will be oriented along the vector from the center of the circle to the first node.The local y-axis is the cross product of the local z-axis and the local x-axis. This is the 2nd row of basic2local.
Noting that
v1andv2are chords, the bisector of each chord is found by crossing the z-axis unit vector with the chord. Call these bisector vectorsb1andb2.Compute the midpoint of each chord:
mid1is center ofv1andmid2is center ofv2.Let center denote the center of the circle. Since both bisectors must pass through center:
mid1 + alpha * b1 = center
mid2 + beta * b2 = center
where
alphaandbetaare unknown scalars. Subtracting the second equation from the first gives:alpha * b1 - beta * b2 = mid2 - mid1
That equation is actually three equations with two of them being independent. Therefore, we can solve for
alphaandbetausing a least-squares approach (numpy.linalg.lstsq()). Then, we can use either of the two equations above to solve for center. Note the center is in basic coordinates.The coordinates of all points can now be calculated in the local coordinate system (note that the local z-coordinate is 0.0 for all points):
local = basic2local @ (basic - center)
The radius for each point in
localis simply the root-sum- square of each local x & y coordinate. This routine computes the average radius and sum of the squares of the radius errors for each point.For cases where there are more than three data points, this routine optimizes the fit by using
scipy.optimize.leastsq(). The five optimization variables are the direction of local z-axis (two angles) and the location of the center point.
Examples
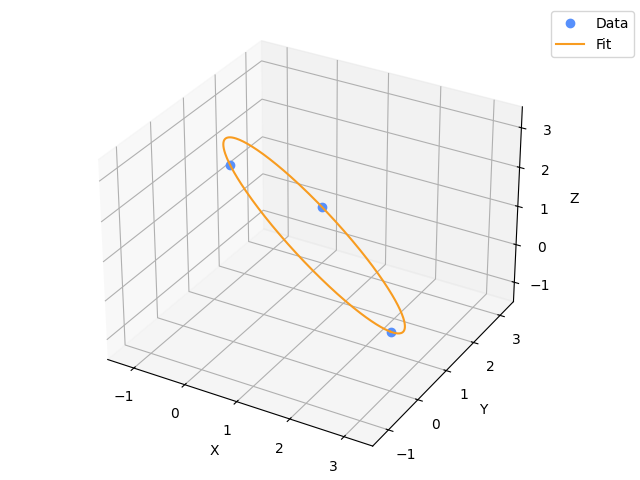
Fit a circle through the three points: [3, 0, 0], [0, 3, 0] and [0, 0, 3]. The center should be at [1, 1, 1]:
>>> import numpy as np
>>> from pyyeti.ytools import fit_circle_3d
>>> params = fit_circle_3d(3*np.eye(3), makeplot='new')
>>> params.center
array([ 1.,  1.,  1.])