pyyeti.srs.srsmap
- pyyeti.srs.srsmap(timeslice, tsoverlap, sig, sr, freq, Q, wep=0, **srsargs)[source]
Make a shock response spectral map (‘waterfall’) over time and frequency.
- Parameters:
timeslice (scalar or string-integer) – If scalar, it is the length in seconds for each slice. If string, it contains the integer number of points for each slice. For example, if sr is 1000 samples/second,
timeslice=0.75is equivalent totimeslice="750".tsoverlap (scalar in [0, 1) or string-integer) – If scalar, is the fraction of each time-slice to overlap. If string, it contains the integer number of points to overlap. For example, if sr is 1000 samples/second,
tsoverlap=0.5andtsoverlap="500"each specify 50% overlap.sig (1d array_like) – Base acceleration signal; vector.
sr (scalar) – The sample rate (samples/sec)
freq (array_like) – Frequency vector in Hz. This defines the single DOF systems to use.
Q (scalar) – Dynamic amplification factor \(Q = 1/(2\zeta)\) where \(\zeta\) is the fraction of critical damping.
wep (scalar) – Argument for the
pyyeti.dsp.windowends(); specifies the window-ends portion. Each time slice is passed throughpyyeti.dsp.windowends()if wep > 0.**srsargs (miscellaneous options for
srs()) – Allows the setting of ic, stype, peak, eqsine, etc options forsrs(). Seesrs()for more information.
- Returns:
mp (2d ndarray) – The SRS map; columns span time, rows span frequency (so each column is an SRS curve). Time increases going across the columns and frequency increases going down the rows.
t (1d ndarray) – Time vector of center times; corresponds to columns in map. Signal is assumed to start at time = 0.
f (1d ndarray) – Frequency vector equal to the input freq; corresponds to rows in map.
Notes
This routine calls
pyyeti.dsp.waterfall()for handling the timeslices and preparing the output.srs()andpyyeti.dsp.windowends()are passed to that function.See also
Examples
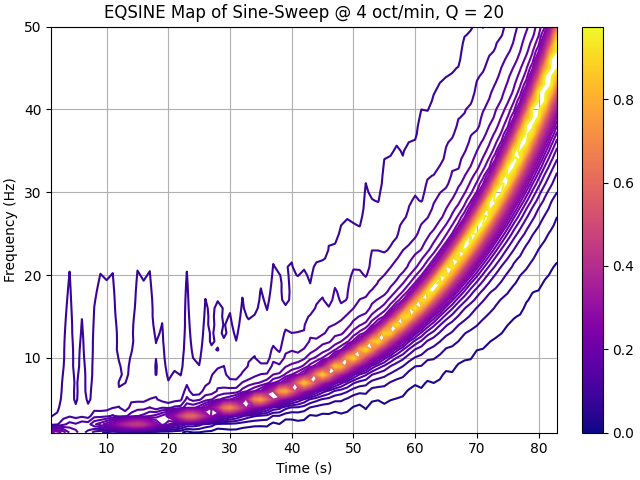
Generate a sine sweep signal @ 4 octaves/min; process in 2-second windows with 50% overlap; 2% windowends, compute equivalent sine.
>>> import numpy as np
>>> import matplotlib.pyplot as plt
>>> from pyyeti import srs
>>> from pyyeti import ytools
>>> from matplotlib import cm, colors
>>> sig, t, f = ytools.gensweep(10, 1, 50, 4)
>>> sr = 1/t[1]
>>> frq = np.arange(1., 50.1)
>>> Q = 20
>>> mp, t, f = srs.srsmap(2, .5, sig, sr, frq, Q, .02,
...                       eqsine=1)
>>> _ = plt.figure('Example', clear=True, layout='constrained')
>>> cs = plt.contour(t, f, mp, 40, cmap=cm.plasma)
>>> # This doesn't work in matplotlib 3.5.0:
>>> #   cbar = plt.colorbar()
>>> #   cbar.filled = True
>>> #   cbar.draw_all()
>>> # But this does:
>>> norm = colors.Normalize(
...            vmin=cs.cvalues.min(), vmax=cs.cvalues.max()
...        )
>>> sm = plt.cm.ScalarMappable(norm=norm, cmap=cs.cmap)
>>> cb = plt.colorbar(sm, ax=plt.gca())  # , ticks=cs.levels)
>>> #
>>> _ = plt.xlabel('Time (s)')
>>> _ = plt.ylabel('Frequency (Hz)')
>>> ttl = 'EQSINE Map of Sine-Sweep @ 4 oct/min, Q = 20'
>>> _ = plt.title(ttl)
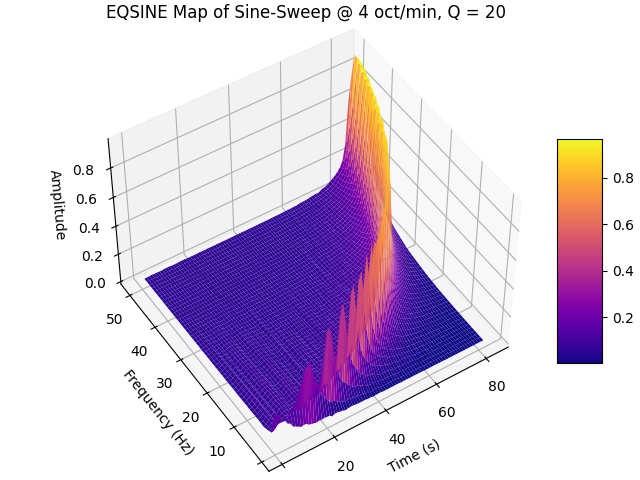
Also show results on a 3D surface plot:
>>> fig = plt.figure("Example 2", clear=True,
...                  layout='constrained')
>>> ax = fig.add_subplot(projection="3d")
>>> x, y = np.meshgrid(t, f)
>>> surf = ax.plot_surface(x, y, mp, rstride=1, cstride=1,
...                        linewidth=0, cmap=cm.plasma)
>>> _ = fig.colorbar(surf, shrink=0.5, aspect=5)
>>> ax.view_init(azim=-123, elev=48)
>>> _ = ax.set_xlabel('Time (s)')
>>> _ = ax.set_ylabel('Frequency (Hz)')
>>> _ = ax.set_zlabel('Amplitude')
>>> _ = plt.title(ttl)