pyyeti.dsp.calcenv
- pyyeti.dsp.calcenv(x, y, p=5, n=2000, method='max', base=0.0, makeplot='clear', polycolor=(1, 0.7, 0.7), label='data')[source]
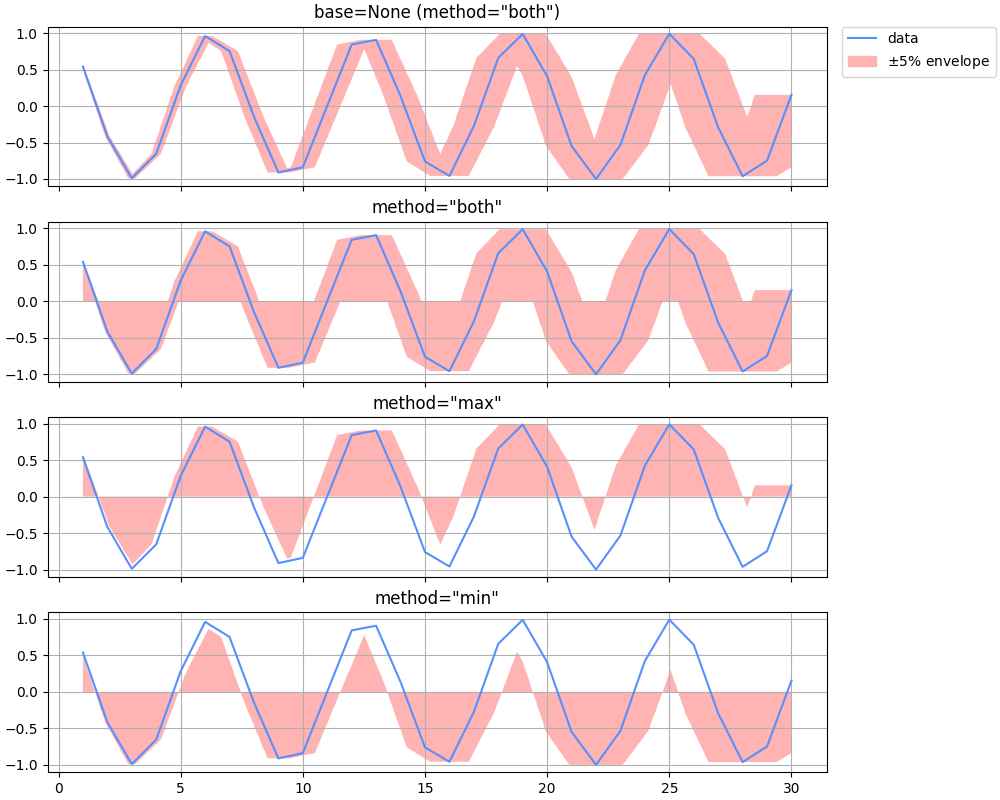
Returns a curve that envelopes the y data that is allowed to shift in the x-direction by some percentage. Optionally plots original curve with shaded enveloping polygon.
- Parameters:
x (array_like) – x-axis data vector; must be monotonically ascending
y (array_like) – y-axis data vector; must be same length as x
p (scalar; optional) – Percentage to shift the y data left and right
n (integer; optional) – Number of points to use for enveloping curve
method (string; optional) – Specifies how to envelop data:
method
Description
‘max’
compute envelope over the maximum values of y
‘min’
compute envelope over the minimum values of y
‘both’
combine both ‘max’ and ‘min’
base (scalar or None; optional) – The base y-value (defines one side of the envelope); if None, no base y-value is used and method is automatically set to ‘both’
makeplot (string or axes object; optional) – Specifies if and how to plot envelope in current figure:
makeplot
Description
‘no’
do not plot
‘clear’
plot after clearing figure
‘add’
plot without clearing figure
‘new’
plot in new figure
axes object
plot in given axes (like ‘add’)
polycolor (color specification; optional) – Any valid matplotlib color specification for the color of the enveloping curve
label (string; optional) – Label for the x-y data on plot (only used if makeplot is not ‘no’)
- Returns:
xe_max (1d ndarray) – x-axis data vector for enveloping curve on max side
ye_max (1d ndarray) – y-axis data vector for enveloping curve on max side
xe_min (1d ndarray) – x-axis data vector for enveloping curve on min side
ye_min (1d ndarray) – y-axis data vector for enveloping curve on min side
h (None or list) – If makeplot is not ‘no’, h is a 2-element list of graphic handles: [line, patch].
Examples
>>> import numpy as np
>>> import matplotlib.pyplot as plt
>>> from pyyeti import dsp
>>> x = np.arange(1.0, 31.0, 1.0)
>>> y = np.cos(x)
>>> fig = plt.figure('Example', figsize=[10, 8], clear=True,
...                  layout='constrained')
>>>
>>> ax = plt.subplot(411)
>>> env = dsp.calcenv(x, y, base=None, makeplot='add')
>>> _ = plt.title('base=None (method="both")')
>>> _ = ax.legend(handles=env[-1], loc='upper left',
...               bbox_to_anchor=(1.02, 1.),
...               borderaxespad=0.)
>>> _ = ax.set_xticklabels([])
>>>
>>> ax = plt.subplot(412)
>>> env = dsp.calcenv(x, y, method='both', makeplot='add')
>>> _ = plt.title('method="both"')
>>> ax.legend().set_visible(False)
>>> _ = ax.set_xticklabels([])
>>>
>>> ax = plt.subplot(413)
>>> env = dsp.calcenv(x, y, method='max', makeplot='add')
>>> _ = plt.title('method="max"')
>>> ax.legend().set_visible(False)
>>> _ = ax.set_xticklabels([])
>>>
>>> ax = plt.subplot(414)
>>> env = dsp.calcenv(x, y, method='min', makeplot='add')
>>> _ = plt.title('method="min"')
>>> ax.legend().set_visible(False)