pyyeti.dsp.fdscale
- pyyeti.dsp.fdscale(y, sr, scale, axis=-1)[source]
Scale a time signal in the frequency domain.
- Parameters:
y (nd array_like) – Signal(s) to be scaled. Scaling is done along axis axis.
sr (scalar) – Sample rate.
scale (2d array_like) – A two column matrix of [freq scale]. It is automatically sized to the correct dimensions via linear interpolation (uses
numpy.interp()).axis (int, optional) – Axis along which to operate.
- Returns:
y_new (nd ndarray) – The scaled version of y.
Notes
This routine uses FFT to convert y to the frequency domain, applies the scale factors, and does an inverse FFT to get back to the time domain. For example, using
scale = [[1. 1.], [100., 1.]]would accomplish nothing.The function
scipy.signal.firwin2()can accomplish a similar scaling via a digital filter.Examples
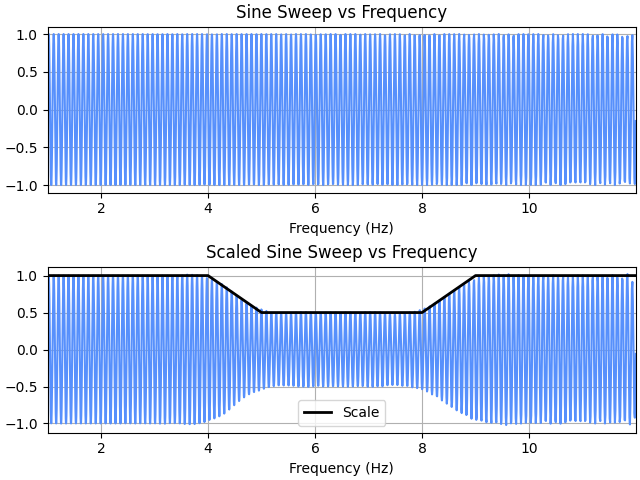
Generate a unit amplitude sine sweep signal and scale down the middle section:
>>> from pyyeti import ytools, dsp
>>> import matplotlib.pyplot as plt
>>> sig, t, f = ytools.gensweep(10, 1, 12, 8)
>>> scale = np.array([[0., 1.0],
...                   [4., 1.0],
...                   [5., 0.5],
...                   [8., 0.5],
...                   [9., 1.0],
...                   [100., 1.0]])
>>> sig_scaled = dsp.fdscale(sig, 1/t[1], scale)
>>> _ = plt.figure('Example', clear=True, layout='constrained')
>>> _ = plt.subplot(211)
>>> _ = plt.plot(f, sig)
>>> _ = plt.title('Sine Sweep vs Frequency')
>>> _ = plt.xlabel('Frequency (Hz)')
>>> _ = plt.xlim([f[0], f[-1]])
>>> _ = plt.subplot(212)
>>> _ = plt.plot(f, sig_scaled)
>>> _ = plt.plot(*scale.T, 'k-', lw=2, label='Scale')
>>> _ = plt.legend(loc='best')
>>> _ = plt.title('Scaled Sine Sweep vs Frequency')
>>> _ = plt.xlabel('Frequency (Hz)')
>>> _ = plt.xlim([f[0], f[-1]])
>>> _ = plt.grid(True)