pyyeti.dsp.fftmap
- pyyeti.dsp.fftmap(timeslice, tsoverlap, sig, sr, window='hann', dodetrend=False, fold=True, maxdf=None)[source]
Make an FFT map (‘waterfall’) over time and frequency.
- Parameters:
timeslice (scalar or string-integer) – If scalar, it is the length in seconds for each slice. If string, it contains the integer number of points for each slice. For example, if sr is 1000 samples/second,
timeslice=0.75is equivalent totimeslice="750".tsoverlap (scalar in [0, 1) or string-integer) – If scalar, is the fraction of each time-slice to overlap. If string, it contains the integer number of points to overlap. For example, if sr is 1000 samples/second,
tsoverlap=0.5andtsoverlap="500"each specify 50% overlap.sig (1d array_like) – Signal to compute FFT map of.
sr (scalar) – The sample rate (samples/sec)
window (string, tuple, or 1d array_like; optional) – Specifies window function. If a string or tuple, it is passed to
scipy.signal.get_window()to get the window. If 1d array_like, it must be lengthlen(x)and is used directly.dodetrend (bool; optional) – If True, remove a linear fit from x; otherwise, no detrending is done.
fold (bool; optional) – If true, “fold” negative frequencies on top of positive frequencies such that the coefficients at frequencies that have a negative counterpart are doubled (magnitude is also doubled).
maxdf (scalar or None; optional) – If scalar, this is the maximum allowed frequency step; zero padding will be done if necessary to enforce this. Note that this is for providing more points between peaks only. If None, the delta frequency is simply
sr/len(x).
- Returns:
mp (2d ndarray) – The FFT map; columns span time, rows span frequency (so each column is an FFT curve). Time increases going across the columns and frequency increases going down the rows.
t (1d ndarray) – Time vector of center times; corresponds to columns in map. Signal is assumed to start at time = 0.
f (1d ndarray) – Frequency vector; corresponds to rows in map.
Notes
This routine calls
fftcoef()for each time slice. mp is a matrix where each column is the FFT magnitude at all discrete frequencies for a certain time-slice. That is, time increases going across the columns and frequency increases going down the rows.See also
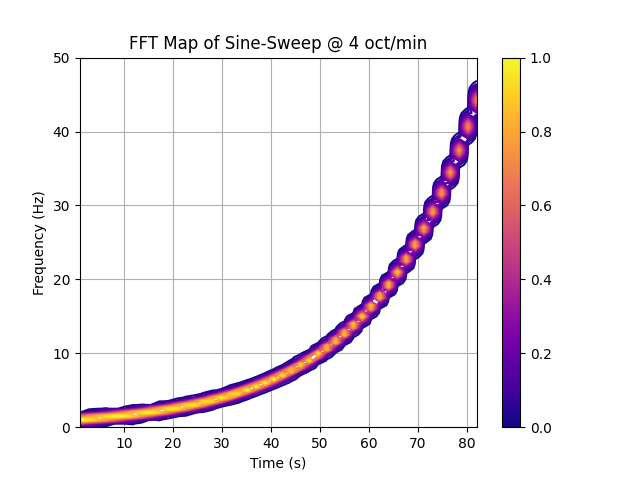
Examples
>>> import numpy as np
>>> import matplotlib.pyplot as plt
>>> from matplotlib import cm, colors
>>> from pyyeti import dsp, ytools
>>> sig, t, f = ytools.gensweep(10, 1, 50, 4)
>>> sr = 1/t[1]
>>> mp, t, f = dsp.fftmap(2, .1, sig, sr)
>>> pv = f <= 50.0
>>> cs = plt.contour(t, f[pv], mp[pv], 40, cmap=cm.plasma)
>>> # This doesn't work in matplotlib 3.5.0:
>>> #   cbar = plt.colorbar()
>>> #   cbar.filled = True
>>> #   cbar.draw_all()
>>> # But this does:
>>> norm = colors.Normalize(
...            vmin=cs.cvalues.min(), vmax=cs.cvalues.max()
...        )
>>> sm = plt.cm.ScalarMappable(norm=norm, cmap=cs.cmap)
>>> cb = plt.colorbar(sm, ax=plt.gca())  # , ticks=cs.levels)
>>> #
>>> _ = plt.xlabel('Time (s)')
>>> _ = plt.ylabel('Frequency (Hz)')
>>> ttl = 'FFT Map of Sine-Sweep @ 4 oct/min'
>>> _ = plt.title(ttl)