pyyeti.dsp.resample
- pyyeti.dsp.resample(data, p, q, *, axis=-1, beta=14, pts=10, t=None, getfir=False)[source]
Change sample rate of data by a rational factor using Lanczos resampling.
- Parameters:
data (nd array_like) – Data to be resampled. The resampling is done along axis axis.
p (integer) – The upsample factor.
q (integer) – The downsample factor.
axis (int, optional) – Axis along which to operate.
beta (scalar) – The beta value for the Kaiser window. See
scipy.signal.windows.kaiser().pts (integer) – Number of points in data to average from each side of current data point. For example, if
pts == 10, a total 21 points of original data are used for averaging.t (array_like) – If t is given, it is assumed to be the sample positions associated with the signal data in data and the new (resampled) positions are returned.
getfir (bool) – If True, the FIR filter coefficients are returned.
- Returns:
rdata (nd ndarray) – The resampled data. If the signal(s) in data have n samples, the signal(s) in rdata have
ceil(n*p/q)samples.tnew (1d ndarray; optional) – The resampled positions, same length as rdata. Only returned if t is input.
fir (1d ndarray; optional) – The FIR filter coefficients.
len(fir) = 2*pts*max(p, q)/gcd(p, q) + 1.gcd(p, q)is the greatest common denominator of p and q. fir is only returned if getfir is True.
Notes
This routine takes care not to introduce new frequency content when upsampling and not to alias higher frequency content into the lower frequencies when downsampling. It performs these basic steps:
Removes the mean from data:
mdata = data-mean(data).Inserts
p-1zeros after every point in mdata.Forms an averaging, anti-aliasing FIR filter based on the ‘sinc’ function and the Kaiser window to filter mdata.
Each original point gets retained as-is (it gets multiplied by 1.0 and the other original data points get multiplied by 0.0).
The new zero points are a weighted average (by distance) of the original points. The averaging coefficients (in the FIR filter) sum to 1.0
The frequency cutoff for the filter is the minimum of the original sample rate divided by two, or the final sample rate divided by two. This ensures there is no aliasing.
Downsamples by selecting every q points in filtered data.
Adds the mean value(s) back on to final result.
Using more points in the averaging results in more accuracy at the cost of run-time. From tests, upsampling with this routine approaches the output of
scipy.signal.resample()as pts is increased except near the end points, where the periodic nature of the FFT (used inscipy.signal.resample()) becomes evident. See the first example below.When upsampling by a factor, the original points in data are retained.
See also
Examples
The first example upsamples a hand-picked data vector to show how this routine compares and contrasts with the FFT method in
scipy.signal.resample().>>> from pyyeti import dsp >>> import scipy.signal as signal >>> import numpy as np >>> import matplotlib.pyplot as plt >>> import numpy.fft as fft >>> p = 3 >>> q = 1 >>> data = [0., -0.08, 0.8, 1.6, -1.7, -1.8, 2, 0., 0.7, -1.5] >>> n = len(data) >>> x = np.arange(n) >>> upx = np.arange(n*p)/p >>> _ = plt.figure('Example', figsize=(10, 8), clear=True, ... layout='constrained') >>> _ = plt.subplot(211) >>> _ = plt.plot(x, data, 'o-', label='Original') >>> res = {} >>> for pts, m in zip([3, 5, 7, 10], ... ['^', 'v', '<', '>']): ... res[pts], up2 = dsp.resample(data, p, q, pts=pts, t=x) ... lab = f'Resample, pts={pts}' ... _ = plt.plot(upx, res[pts], '-', label=lab, marker=m) >>> resfft = signal.resample(data, p*n) >>> _ = plt.plot(upx, resfft, '-D', label='scipy.signal.resample') >>> _ = plt.legend(loc='best') >>> _ = plt.title('Signal') >>> _ = plt.xlabel('Time') >>> _ = plt.subplot(212) >>> n2 = len(upx) >>> frq = fft.rfftfreq(n, 1) >>> frqup = fft.rfftfreq(n2, 1/p) >>> _ = plt.plot(frq, 2*np.abs(fft.rfft(data))/n, ... label='Original') >>> _ = plt.plot(frqup, 2*np.abs(fft.rfft(res[5]))/n2, ... label='Resample, pts=5') >>> _ = plt.plot(frqup, 2*np.abs(fft.rfft(res[10]))/n2, ... label='Resample, pts=10') >>> _ = plt.plot(frqup, 2*np.abs(fft.rfft(resfft))/n2, ... label='scipy.signal.resample') >>> _ = plt.legend(loc='best') >>> _ = plt.title('FFT Mag.') >>> _ = plt.xlabel('Frequency - fraction of original sample rate') >>> np.allclose(up2, upx) True >>> np.allclose(res[5][::p], data) # original data still here True

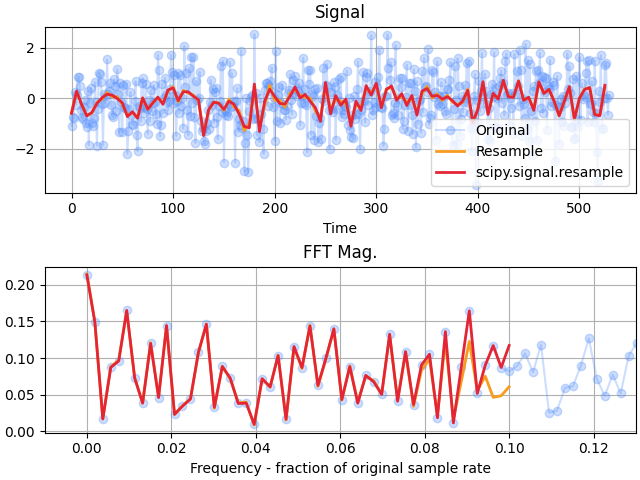
For another example, downsample some random data:
>>> p = 1
>>> q = 5
>>> n = 530
>>> rng = np.random.default_rng(seed=10)
>>> data = rng.normal(size=n)
>>> x = np.arange(n)
>>> dndata, dnx = dsp.resample(data, p, q, t=x)
>>> fig = plt.figure('Example 2', clear=True,
...                  layout='constrained')
>>> _ = plt.subplot(211)
>>> _ = plt.plot(x, data, 'o-', label='Original', alpha=0.3)
>>> _ = plt.plot(dnx, dndata, label='Resample', lw=2)
>>> resfft = signal.resample(data, int(np.ceil(n/q)))
>>> _ = plt.plot(
...         dnx, resfft, label='scipy.signal.resample', lw=2
...     )
>>> _ = plt.legend(loc='best')
>>> _ = plt.title('Signal')
>>> _ = plt.xlabel('Time')
>>> _ = plt.subplot(212)
>>> n2 = len(dnx)
>>> frq = fft.rfftfreq(n, 1)
>>> frqdn = fft.rfftfreq(n2, q)
>>> _ = plt.plot(
...         frq, 2*np.abs(fft.rfft(data))/n, 'o-', alpha=.3
...     )
>>> _ = plt.plot(frqdn, 2*np.abs(fft.rfft(dndata))/n2, lw=2)
>>> _ = plt.plot(frqdn, 2*np.abs(fft.rfft(resfft))/n2, lw=2)
>>> _ = plt.title('FFT Mag.')
>>> xlbl = 'Frequency - fraction of original sample rate'
>>> _ = plt.xlabel(xlbl)
>>> _ = plt.xlim(-0.01, 0.13)