pyyeti.dsp.waterfall
- pyyeti.dsp.waterfall(sig, sr, timeslice, tsoverlap, func, which, freq, t0=0.0, args=None, kwargs=None, slicefunc=None, sliceargs=None, slicekwargs=None)[source]
Compute a ‘waterfall’ map over time and frequency (typically) using a user-supplied function.
- Parameters:
sig (1d array_like) – Time series of measurement values.
sr (scalar) – Sample rate.
timeslice (scalar or string-integer) – If scalar, it is the length in seconds for each slice. If string, it contains the integer number of points for each slice. For example, if sr is 1000 samples/second,
timeslice=0.75is equivalent totimeslice="750".tsoverlap (scalar in [0, 1) or string-integer) – If scalar, is the fraction of each time-slice to overlap. If string, it contains the integer number of points to overlap. For example, if sr is 1000 samples/second,
tsoverlap=0.5andtsoverlap="500"each specify 50% overlap.func (function) – This function is called for each time slice (denoted as “sig_slice” here) and is expected to return amplitude values across the frequency range. It can return just the amplitudes, or it can have multiple outputs (see also which and freq). The call is:
func(sig_slice, *args,
**kwargs)
. Note that the “sig_slice” input is first passed through slicefunc if one is provided (see below).which (None or integer) – Set to None if func only returns the amplitudes. Otherwise, if func returns multiple outputs, set which to the index of the output corresponding to the amplitudes. For example, if func returns
(frequencies, amplitudes), which would be 1 (and freq would be 0).Note
Setting which to None is not the same as setting it to 0. Using None means that the function only returns amplitudes, while a 0 indicates that the output of func must be indexed by 0 to get the amplitudes. For example: if the function has
return amps, usewhich=None; if the function hasreturn (amps,), usewhich=0.freq (integer or vector) – If integer, it is the index of the output of func corresponding to the frequency vector and cannot be equal to which. Otherwise, if freq is a vector, it is the frequency vector directly.
t0 (scalar; optional) – Start time of signal; defaults to 0.0.
args (tuple or list; optional) – If provided, these are passed to func.
kwargs (dict; optional) – If provided, these are passed to func.
slicefunc (function or None; optional) – If a function, it is called for each time-slice before func is called. This could be for windowing or detrending, for example. The call is:
sig_slice = slicefunc(sig[pv], *sliceargs, **slicekwargs).sliceargs (tuple or list; optional) – If provided, these are passed to slicefunc. Must be None or () if slicefunc is None.
slicekwargs (dict; optional) – If provided, these are passed to slicefunc. Must be None or {} if slicefunc is None.
- Returns:
mp (2d ndarray) – The waterfall map; columns span time, rows span frequency. So, each column is a vector of frequency amplitudes as returned by func for a specific time-slice. Time increases going across the columns and frequency increases going down the rows.
t (1d ndarray) – Time vector of center times; corresponds to columns in mp. Signal is assumed to start at time = t0.
f (1d ndarray) – Frequency vector corresponding to rows in mp. Either equal to the input freq or as returned by func.
Notes
Even though the example below shows the use of args and sliceargs, it is recommended to only use kwargs and slicekwargs only to pass arguments to the supplied functions. This makes for more readable code.
Examples
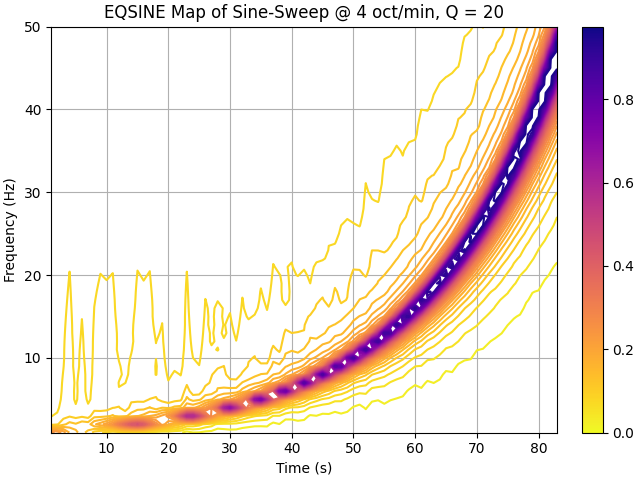
Compute a shock response spectrum waterfall for a sine sweep signal. The sweep rate 4 octaves/min. Process in 2-second windows with 50% overlap; 2% windowends, compute equivalent sine.
>>> import numpy as np
>>> import matplotlib.pyplot as plt
>>> from pyyeti import srs, ytools, dsp
>>> from matplotlib import cm, colors
>>> sig, t, f = ytools.gensweep(10, 1, 50, 4)
>>> sr = 1/t[1]
>>> frq = np.arange(1., 50.1)
>>> Q = 20
>>> mp, t, f = dsp.waterfall(sig, sr, 2, 0.5, srs.srs,
...                          which=None, freq=frq,
...                          args=(sr, frq, Q),
...                          kwargs=dict(eqsine=1),
...                          slicefunc=dsp.windowends,
...                          sliceargs=[.02],
...                          slicekwargs=dict(ends='front'))
>>> _ = plt.figure('Example', clear=True, layout='constrained')
>>> cs = plt.contour(t, f, mp, 40, cmap=cm.plasma_r)
>>> # This doesn't work in matplotlib 3.5.0:
>>> #   cbar = plt.colorbar()
>>> #   cbar.filled = True
>>> #   cbar.draw_all()
>>> # But this does:
>>> norm = colors.Normalize(
...            vmin=cs.cvalues.min(), vmax=cs.cvalues.max()
...        )
>>> sm = plt.cm.ScalarMappable(norm=norm, cmap=cs.cmap)
>>> cb = plt.colorbar(sm, ax=plt.gca())  # , ticks=cs.levels)
>>> #
>>> _ = plt.xlabel('Time (s)')
>>> _ = plt.ylabel('Frequency (Hz)')
>>> ttl = 'EQSINE Map of Sine-Sweep @ 4 oct/min, Q = 20'
>>> _ = plt.title(ttl)
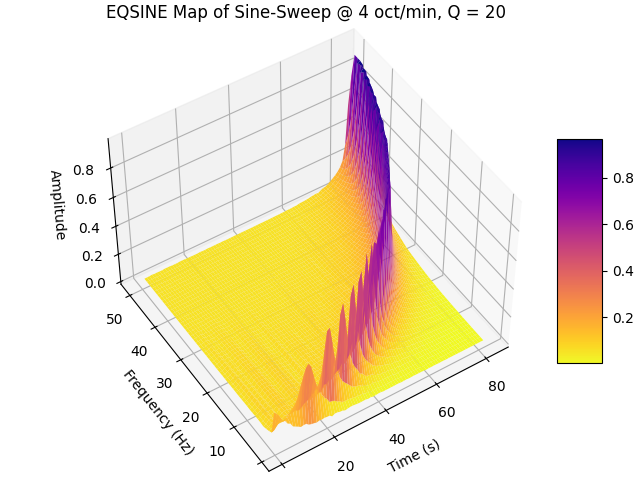
Also show results on a 3D surface plot:
>>> fig = plt.figure("Example 2", clear=True,
...                  layout='constrained')
>>> ax = fig.add_subplot(projection="3d")
>>> x, y = np.meshgrid(t, f)
>>> surf = ax.plot_surface(x, y, mp, rstride=1, cstride=1,
...                        linewidth=0, cmap=cm.plasma_r)
>>> _ = fig.colorbar(surf, shrink=0.5, aspect=5)
>>> ax.view_init(azim=-123, elev=48)
>>> _ = ax.set_xlabel('Time (s)')
>>> _ = ax.set_ylabel('Frequency (Hz)')
>>> _ = ax.set_zlabel('Amplitude')
>>> _ = plt.title(ttl)