pyyeti.psd.psdmod
- pyyeti.psd.psdmod(sig, sr, nperseg=None, timeslice=1.0, tsoverlap=0.5, getmap=False, **kwargs)[source]
Modified method for PSD estimation via FFT.
- Parameters:
sig (1d array_like) – Time series of measurement values.
sr (scalar) – Sample rate.
nperseg (int, optional) – Length of each segment for the FFT. Defaults to
int(sr / 5)for 5 Hz frequency step in PSD. Note: frequency step in Hz =sr/nperseg.timeslice (scalar or string-integer) – If scalar, it is the length in seconds for each slice. If string, it contains the integer number of points for each slice. For example, if sr is 1000 samples/second,
timeslice=0.75is equivalent totimeslice="750".tsoverlap (scalar in [0, 1) or string-integer) – If scalar, is the fraction of each time-slice to overlap. If string, it contains the integer number of points to overlap. For example, if sr is 1000 samples/second,
tsoverlap=0.5andtsoverlap="500"each specify 50% overlap.getmap (bool, optional) – If True, get the PSD map output (the Pmap and t variables described below).
*kwargs (optional) – Named arguments to pass to
scipy.signal.welch().
- Returns:
f (1d ndarray) – Array of sample frequencies.
Pxx (1d ndarray) – Power spectral density or power spectrum of sig.
Pmap (2d ndarray; optional) – The PSD map; each column is an output of
scipy.signal.welch(). Rows correspond to frequency f and columns correspond to time t. Only output if getmap is True.t (1d ndarray; optional) – The time vector for the columns of Pmap. Only output if getmap is True.
Notes
This routine calls
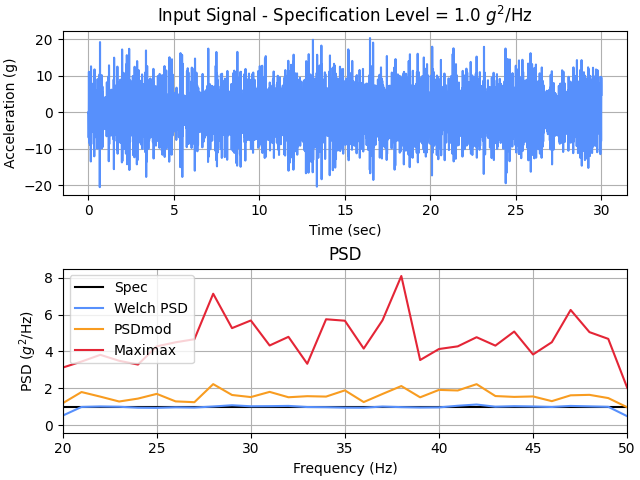
pyyeti.dsp.waterfall()for handling the timeslices and preparing the output andscipy.signal.welch()to process each time slice. So, the “modified” method is to use the PSD averaging (via welch) for each time slice but then take the peaks over all these averages.For a pure ‘maximax’ PSD, just set timeslice to
nperseg/srand tsoverlap to 0.5 (assuming 50% overlap is desired). Conversely, for a pure Welch periodogram, just set the timeslice equal to the entire signal (or just usescipy.signal.welch()of course). Usually the desired behavior forpsdmod()is somewhere between these two extremes.Examples
>>> import numpy as np
>>> import matplotlib.pyplot as plt
>>> from pyyeti import psd
>>> from scipy import signal
>>> TF = 30  # make a 30 second signal
>>> spec = np.array([[20, 1], [50, 1]])
>>> sig, sr, t = psd.psd2time(spec, ppc=10, fstart=20,
...                           fstop=50, df=1/TF,
...                           winends=dict(portion=10),
...                           gettime=True)
>>> f, p = signal.welch(sig, sr, nperseg=sr)
>>> f2, p2 = psd.psdmod(sig, sr, nperseg=sr, timeslice=4,
...                     tsoverlap=0.5)
>>> f3, p3 = psd.psdmod(sig, sr, nperseg=sr)
>>> spec = spec.T
>>> fig = plt.figure('Example', clear=True,
...                  layout='constrained')
>>> _ = plt.subplot(211)
>>> _ = plt.plot(t, sig)
>>> _ = plt.title(r'Input Signal - Specification Level = '
...               '1.0 $g^{2}$/Hz')
>>> _ = plt.xlabel('Time (sec)')
>>> _ = plt.ylabel('Acceleration (g)')
>>> _ = plt.subplot(212)
>>> _ = plt.plot(*spec, 'k-', lw=1.5, label='Spec')
>>> _ = plt.plot(f, p, label='Welch PSD')
>>> _ = plt.plot(f2, p2, label='PSDmod')
>>> _ = plt.plot(f3, p3, label='Maximax')
>>> _ = plt.legend(loc='best')
>>> _ = plt.xlim(20, 50)
>>> _ = plt.title('PSD')
>>> _ = plt.xlabel('Frequency (Hz)')
>>> _ = plt.ylabel(r'PSD ($g^2$/Hz)')